Size Might Not Matter in the MLB
By Ben Tyler Elliott
To the casual observer, baseball doesn’t present itself as a particularly impressive or athletic sport. And yet, the majority of those mostly-ordinary looking folks playing televised baseball are millionaires…
Further influencing the sport’s non-athletic perception is the truth that many — if not most — professional baseball players don’t look like freakish athletes. When a non-baseball enthusiast asks me about the game, one comment often surfaces in some form or another:
Why are these guys millionaires? None of what they’re doing looks difficult. And it looks like some of these guys are in worse shape than me.*
And even as someone who’s spent about thirty years studying the game — that perception tracks.
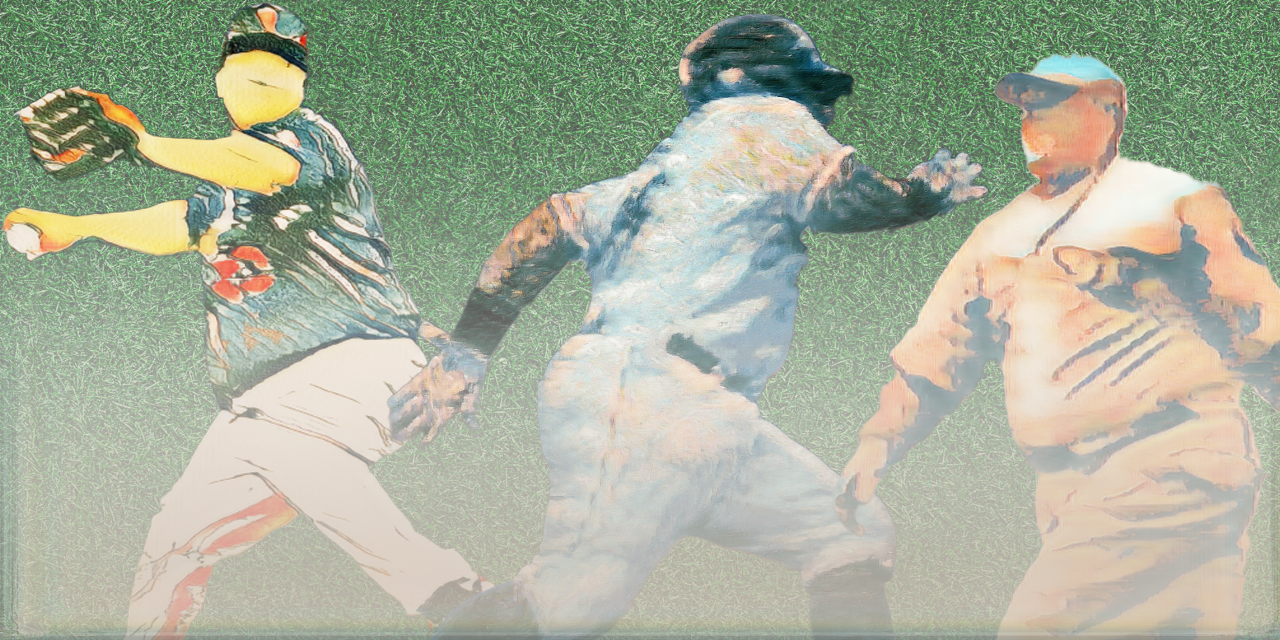
Quick example. Compare these bodies:

Everyone would likely agree that at least one of these people is in stupendous shape. But if you said I’d win twenty bucks if I could correctly identify which (if any) of these folks were professional athletes — I might not pick the guys on sides.
From left to right, these folks are Prince Fielder, Antonio Brown, and Cecil Fielder.
Prince and his dad, Cecil, were big stars in the MLB. Antonio Brown is and/or was an NFL superstar — depending on the week, alignment of the planets, or some other catalyst that the universe has yet to discern.
Baseball Players Come in One Shapes and Sizes
One of the wonderful things about baseball is that there are roughly eleventy-billion ways to quantify what’s going on during a game. And since 1871, folks have been tabulating and aggregating an enormous amount of data about the game, organizing it, and offering it up for baseball fans to digest.
Height and weight are among the metrics that we know for over 99% of all ballplayers.
| Weight | Height (in.) | BMI | |
|---|---|---|---|
| -2σ | 141 | 67 | 23 |
| -1σ | 163 | 70 | 24 |
| 50th | 185 | 72 | 25 |
| 1σ | 207 | 75 | 26 |
| 2σ | 229 | 77 | 27 |
But in a sport where plenty of the players in its pantheon look sort of like this:
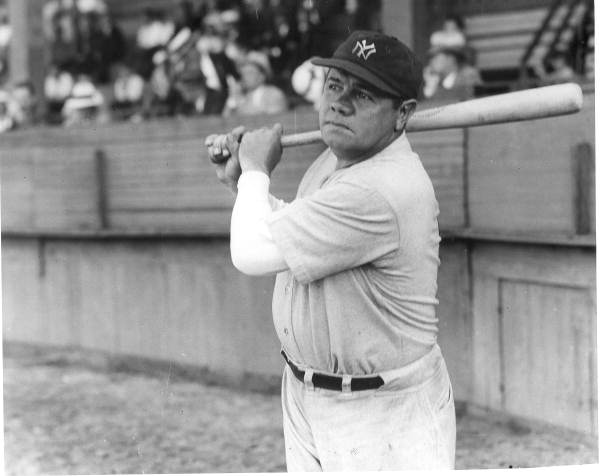
An itchy question begins to instantiate itself about one inch behind my forehead.\
How Terrible Would the All-Time Highest BMI Team Really Be?
Before we go further, let’s talk about how body mass index (BMI) and why it’s terrible by itself.
Here’s how to calculate BMI:
\[\text{BMI} = \frac{\text{Weight in kg}}{\text{(Height in m)}^2}\]Ostensibly, BMI is a mass-to-height ratio that’s useful when broadly classifying a person as underweight, normal weight, overweight, or obese, and for nutritionists, trainers, and doctors, BMI can be one locus of many when assembling an overall snapshot of a person’s health.
But, medically speaking, it’s only useful when you’ve already got actual body composition measurements to prop it up.
E.g.: What if you’re like me and you have an enormous, size-8-ballcap head that weighs fifty pounds?
Or what if you only had three legs? Or four arms?
Because BMI by itself is ignorant of body composition, it’s not a great barometer for whether someone’s in shape.
E.g.g.: Here’s a picture of Arnold Schwarzenegger in 1974. At the time of this photo, his BMI was around 32.
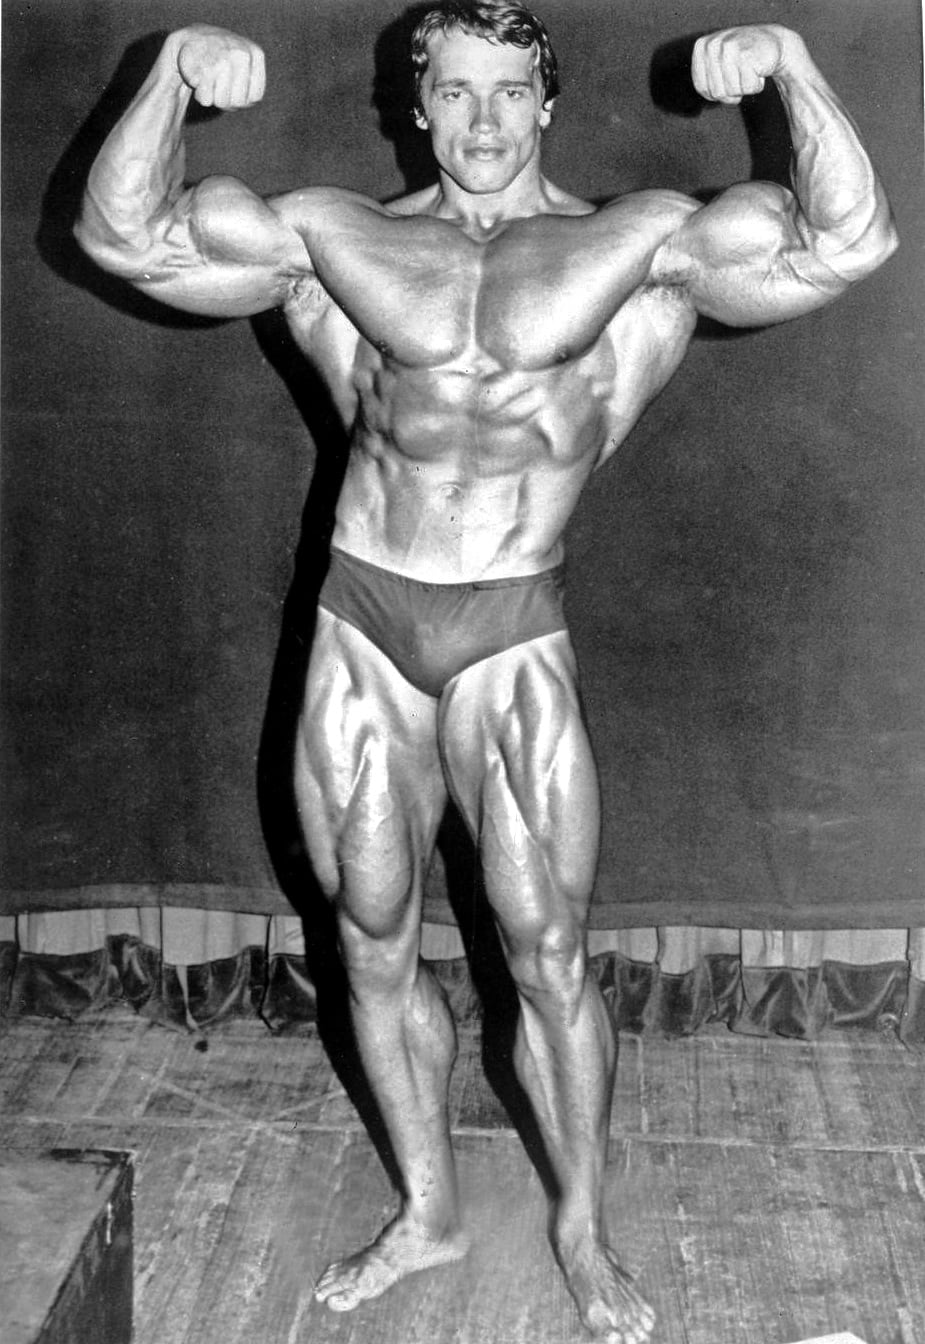
So when I talk about BMI, know that I’m using it in conjunction with other sprint-speed related statistics to quickly filter for baseball players that are probably of the specific body type that I’m trying to find.
Past that, I’m looking at pictures of our candidates to help make a final determination of whether a player’s body looks more like Arnold Schwarzenegger’s or more like me.
I’m interested in assembling a roster of me-types and then seeing how they’d stack up, basically. I’m not here to single out any of these champions in the pejorative. At least for their bodies, anyway.
Stay tuned, because there’s one guy on the roster who’s astonishingly bad at baseball — even though I’m sure he’s a wonderful person.
So Let’s Put a Team Together
Without getting into the weeds, let’s agree that a modern baseball roster comprises 26 players — 13 pitchers and 13 not-pitchers. For a long time, rosters were capped at 25 people during the first five months of the regular season — after which they’d expand to 40 people through the end of the playoffs. During World War I, the Great Depression, and World War II, rosters were exactly 24 people. Before then, it was “up to 25”. Since 2020, rosters have been set at 26, and then expanded to 28 from August 1.
For pitchers, teams generally carry five starters and seven relief pitchers, who are brought into games at opportune moments, or when the starting pitcher is worn out, or when the current pitcher starts throwing batting practice to the other team.
For not-pitchers, most rosters include:
- Two catchers.
- Five outfielders.
- One each of Shortstop and First, Second, and Third Basemen.
- Two utility players, who can do a lot of things pretty well, but might not be good enough at one position to stick there as an everyday starter.
So if I’m looking to fill a 26-person roster of the least-athletic-looking players out of the 20,000-odd people who have played professional baseball during the last ~150 years, I need to come up with a height/weight/BMI filter to apply to the entire set of players that will yield the smallest subset of players such that I can employ enough high-weight-low-height players at every position on the roster.
One Filter to Rule Them All
Here’s how I built our roster:
Step 1: Initialize a DataFrame comprising every Major League baseball player for whom we have listed both a weight and a height (and a bunch of other cool biographical info that we don’t care about here).
Step 2: Scowl, because this first dataset didn’t include information about which position each player played. But verify that this data does, in fact, exist elsewhere in a similar dataset.
Step 3: Sigh upon discovering that this positional data is indeed coded to each player with a unique ID — but that that unique ID is different from the unique ID in the first dataset.
Step 4: Clap upon discovering that someone else compiled yet another dataset that’s sort of like a Rosetta Stone — it codes every baseball player to any/every of their unique IDs on every major baseball data repository. Step 4.1: Make a note to create yet another unique ID paradigm — to unite all unique ID paradigms.
Step 5: Thrash around in Pandas to make sure our Rosetta dataset merged cleanly into our Biographical dataset before merging our Positional dataset into our Rosettagraphical clown car.
Step 6: Build a filter that aims to return:
- The fewest number of players such that we can still fill out a 26-person roster with qualified players at every position (13x pitchers, 2x catchers, 6x infielders with at least one for each position, 5x outfielders);
- who are as heavy as possible;
- and as short as possible.
Step 7: Assemble the final roster by:
-
Sorting the candidates by descending weight,
-
Iterating through the list of candidates and selecting players by descending weight until the final roster no longer needs any more people at a qualified position.
-
By position, remove every remaining candidate from the pool once the roster requirement is satisfied at that position.
Step 8: Beer myself.
But Does It Work?
After some noodling, I ended up finding that filtering the set of all players for 99th weight and 25th height yielded this pool of candidates:
This was the furthest I could push the filter before I started losing positional representation. 2B and 1B were the bottlenecks.
From these, grouping players by position and sorting by descending weight yields this as the inaugural roster of the Wonkaville Huskies.
And here are two fun little charts that show how our Huskies’ sizes compare to historical means.
Alright. So now we’ve got our roster.
How Good Is This Team?
When you start any sort of comparative analysis between baseball players, the good news is that you’ve got about a zillion ways to see how they measure up. Some of these are super simple.
How many homers did someone hit in a given time period?
And some of these are not simple:
\[SIERA = 6.145 - 16.896 \times \frac{SO}{PA} + 11.434 \times\] \[\frac{BB}{PA} - 1.858 \times \frac{GB-FB-PU}{PA} + \\7.653 \times\] \[(\frac{SO}{PA})^2 \pm 6.664 \times (\frac{GB-FB-PU}{PA})^2 + 10.130 \times\] \[\frac{SO}{PA} \times \\\frac{GB - FB - PU}{PA} - 5.1595 \times \frac{BB}{PA} \times \frac{GB-FB-PU}{PA}\]There are, however, a few specific shiny, golden metrics that cut through much of the statistical noise and simply quantify a player’s value relative to their contemporaries.
For our analysis, we’ll be relying on one of these: Wins Above Replacement (WAR)
WAR! What Is It Good For? (Absolutely Everything)
WAR measures the totality of a player’s value across all aspects of the game by quantifying how many more wins they’re worth compared to a replacement-level player at his same position.
Replacement-level players can be thought of as folks like Minor Leaguers who are still trying to make a Major League roster, or known-quantity journeyman free agents who are better than nothing, but maybe not by much.
To be even more reductive, think of replacement-level players as extras in a movie. Yeah, they’re there — and you’d notice if they weren’t. But at the same time, if you notice them when you shouldn’t, then something’s probably gone horribly wrong.
WAR is adjusted for position, too. Some positions on the field — often referred to as premium positions — are comparatively more difficult to play than others. The premium positions are:
- Catcher
- Shortstop
- Center field
And since it’s much harder to play these positions, team owners are happy to employ premium position players that might not hit the ball as well as, say, any old gargantuan First Baseman — who doesn’t need to be a gymnast in order to play great defense.
Why WAR is Great in One Example or Less
Consider these two Hall-of-Famers
Dan Brouthers was a big, powerful guy who could hit a baseball to the moon. But he played First Base. And not very well. His success was earned almost entirely with his bat.
Ozzie Smith is the greatest defensive shortstop that professional baseball has ever seen. Nobody really cared about whether he was cranking homers and legging out triples so long as he could keep doing stuff like this:
Which was handy for Ozzie — because he sure couldn’t hit.
Pitchers and Batters Can Both Be Described with WAR
Pitchers don’t hit.
This isn’t true, but it’s near to the truth — speaking both literally and figuratively.There are exceptions to this generalization, but for now we’re going to ignore Mr. Ruth and Mr. Ohtani et al. and agree that it’s reasonable to say that pitchers’ value doesn’t hinge on how well they swing the bat.
But it’s not all bad news.
We can still calculate WAR for pitchers, and the resultant numbers are just as valid as any calculation for any batter.
In sum: WAR is simple.
If I’ve got a WAR of 1, then it’s reasonable to say that out of my team’s 162-game season, one of our team’s wins is attributable to my contributions in the aggregate. Had an ‘extra’ been playing my position and taking my at-bats — the team would’ve won one fewer game over the course of the season.
So How ‘Bout Them Huskies?
How ‘bout them Huskies
Are you surprised? I was surprised.
Having gone into this assuming that I’d end up with a roster of folks that didn’t really amount to much over the course of their probably-brief Major League careers, it surprised me to find that this team is…
Not bad!
Actually, it’s better than not-bad.
Hell, they’re better than average.
Finding an analogue: The 1995 Seattle Mariners
In fact, if we’re searching for an analogous historical team that produced similar numbers, our Huskies are about as good as the 1995 Seattle Mariners, who won more than half of their games and finished first in their division.
You’re Making This Up
In order to search for and compare our Huskies and the ‘95 Mariners, I made a few assumptions:
Assumption #1: For each Husky, I set their stats at Baseball Reference’s 162-game average, which is a statistically sound quantification of what statistics you reasonably could expect from that player in a hypothetical 162-game season. They derive these numbers from the player’s historical performances.
Assumption #2: While most players’ performance over the course of their career looks something like a normal distribution, a significant minority have had careers that started or finished extremely strong — and normalizing for the presence and/or severity of this sort of deviation is beyond the scope of what I’ve decided the scope of this thought experiment should be.
So They’re the 1995 Mariners. But How 1995-Marinersy Are They?
They’re about this Marinersy:
Extrapolating Away from Reason
In the future, I’ll revisit this article and simulate the Huskies’ season. But since we have an analogue handy in the 1995 Mariners, let’s look at how these Faux-Huskies compare to some historically good and bad teams.
The 2001 Seattle Mariners won 116 games and then shat the bed in the first round of the playoffs. But that team’s single-season wins record still stands.
It has been said that the 2003 Tigers were mathematically eliminated from the playoffs in late April — which is about one-sixth of the way through the season.
This isn’t true. But on a gut-level, it isn’t not true, either.
Those Tigers were bad, bad, bad.
Rounding Third
So what did we learn today?
In truth, not much.
We already know that BMI is nigh-useless in a vacuum.
Also, we know that baseball is asynchronously balanced. The game needs in equal parts quick-gloved shortstops and outfielders who can throw a baseball into a shopping cart from 300 feet away.
It needs catchers who have memorized every player in the league’s strengths and weaknesses, and it needs steely nerved, crocodile-blooded relief pitchers who can enter a game in a high-leverage situation and mow down the heart of a lineup without breaking a sweat.
And also it needs First Basemen.
And since we’re sifting through some 20,000 players — some of whom had careers lasting over two decades, and some of whom had careers lasting less than two hours — the fact that we’re able to fill a decent roster with the roundest guys we can find shouldn’t be a surprise.
Because baseball is as self-selective as it is fickle, and a player very rarely decides when they’re done playing.
The game makes that decision for them.
“What have you done for me lately?” is the first and last question in a Major League front office.
And if ever the answer is “not much,” then the odds are good that they’ll let you see yourself out. If you’re lucky, they might even validate your parking.
In that way, anyone who made this roster is already probably good enough to play pro ball — regardless of what they look like.
Except Edwar Colina.
Poor guy got shelled and hooked in the first inning of his debut and was out of the league the next day.
Dive Into the Notebook
This little project surprised me. What started as an excuse to keep me motivated while teaching myself to scrape websites turned into yet another quest for an answer to a question that nobody asked. Along the way, I learned quite a bit about scraping websites that think they’re being helpful when, in fact, they’re helping nobody; merging hideous databases of my own design, and REGEXing teardrops back into my body.
If you’d like to play around with the notebook, you have my empathy: